Beta is a relative number. It is measured against a market benchmark. If a stock has beta = 1, then when the market moves 1%, that stock tends to move about 1% as well. We usually treat the benchmark itself as beta = 1. Beta above 1 means the stock tends to swing more than the market, and beta below 1 means it tends to swing less. This is a tendency, not a guarantee. On any given day, company news can overpower everything.
Stock beta: market moves 1%, you move about 1 x beta
What stock beta is
Stock beta is a quick way to describe how strongly a stock usually reacts when the overall market moves.
If the market is up 1% and your stock is up 2% on a typical day, that stock is acting like it has a higher beta. If it barely moves, it is acting like it has a lower beta.
A simple example
Assume a stock has beta = 2.35.
- Market up 1%, the stock often ends up up about 2.35%.
- Market down 1%, the stock often ends up down about 2.35%.
Not always. But often enough that you can use beta as a rough "sensitivity dial".
What beta is (and is not) saying
Beta is not a rating of the company.
Beta is not a prediction of returns.
Beta is closer to: "How much does this thing usually swing with the market?"
Higher beta usually means bigger swings. Bigger swings can be enjoyable when you are right. When you are wrong, the enjoyment becomes more of a historical concept.
Portfolio beta: the weighted average you actually live with
A portfolio beta is the same idea, just for your whole account.
- If you only own one stock, your portfolio beta is basically that stock's beta.
- If you own multiple stocks, your portfolio beta is a weighted average based on exposure.
- If you use options, a practical approach is to turn options into stock-like exposure first (via delta), then include them the same way.
What portfolio beta answers
If the market moves 1%, roughly how much does my account move?
That is the question most people care about, even if they have never used the word "beta" in their life.
A quick reality check
Portfolio beta is not perfectly stable, because portfolios are not perfectly stable. Prices move. Positions change. Options shift. Cash comes and goes. Beta is still useful because it gives you one number you can compare across time.
So what? Why does this matter?
Because most portfolio pain is not caused by one bad stock.
It is caused by not realizing how much market exposure you stacked on top of your equity.
A common pattern looks like this:
- Confidence goes up, position size goes up.
- Fear goes up, position size goes down.
- The account becomes a mood tracker, but that may not be a wise choice.
Portfolio beta gives you a cleaner way to manage risk than "how I feel today".
4 common ways to use portfolio beta
1. Check before you add risk
Before you buy or size up, run the calculator.
If beta jumps from 0.9 to 1.6 after one trade, that trade is not "a small add". It is a meaningful change in how your account will behave.
2. Keep a beta range you can tolerate
Pick a range that matches your temperament and your account.
Example: keep portfolio beta around 0.8 to 1.2.
- Too high: trim exposure.
- Too low: add exposure (if you want).
Not because the range is magic. Because it stops you from steering with vibes.
3. Make margin risk visible
Equity is the anchor. Exposure is the load.
Same exposure with smaller equity means higher portfolio beta. That is leverage, translated into one number you can monitor before the market teaches the lesson for you.
4. Test whether your hedge is doing anything
Bought puts, sold calls, added defensive positions?
Run the calculator again. If portfolio beta barely moved, your hedge may be more of a comforting story than an actual offset.
Portfolio Beta Calculator: how to use it
You enter your equity, add positions, then click the button. The calculator shows your overall market sensitivity and a breakdown by position.
What to enter
Account equity (Equity)
Enter your account equity (net account value). It is not just cash. It is cash + positions, after liabilities.
Stock positions
Add one row per stock:
- Label/Ticker
- Shares
- Price (current price)
- Currency (USD or HKD)
- Stock beta
Use "+ Add Stock" to add rows. Delete what you do not need.
Options positions (optional)
Add one row per option position:
- Type (Call or Put)
- Side (Buy or Sell)
- Contracts
- DTE bucket (time to expiration, in ranges)
- Moneyness (in/at/out of the money, in ranges)
- Underlying price
- Stock Beta
- Currency (USD or HKD)
If those terms are new, here is the short version:
- Delta: how stock-like the option behaves right now.
- DTE: days to expiration (bucketed).
- Moneyness: how far the strike is from the current price (bucketed).
Currency note
The calculator unifies everything into USD internally. If you enter HKD, it converts and then sums.
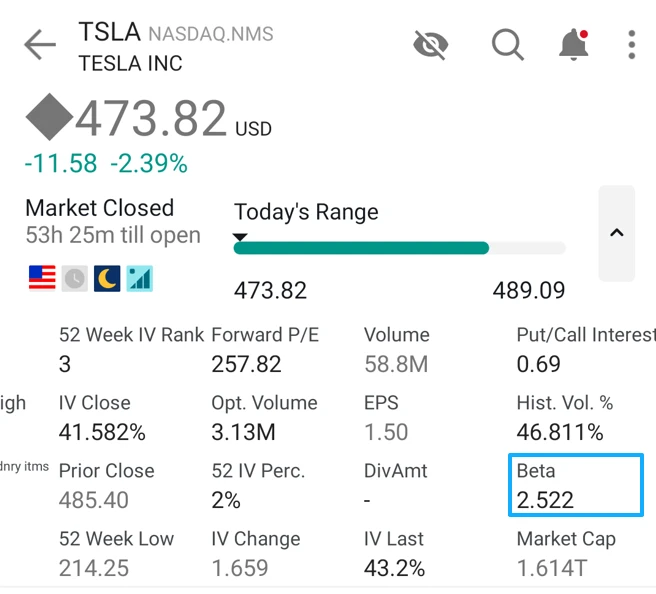
How to find a stock's beta
Most broker apps show beta on the stock detail page. Finance sites also publish beta.
Here's how to get stock beta from Futu HK / Futu Moomoo or IBKR(Interactive Brokers):

Different sources can disagree because they use different windows, frequencies, and benchmarks. That is normal.
Best habit: pick one source and use it consistently for all entries.
Options: what the calculator is doing
Options do not have a single stable "beta" the way stocks do, because their exposure changes as price and time change.
So the calculator uses a practical shortcut:
- Estimate a typical delta based on your DTE and moneyness buckets.
- Convert delta into equivalent shares (per contract, think in units of 100 shares).
- Treat that as stock-like exposure, then apply the underlying stock beta.
This is meant to be useful for a quick exposure check, not a precision risk system.
Options estimates get noisier when:
- the option is very close to expiration
- the option is very far out of the money
- volatility is moving fast
In those cases, delta can change quickly and bucket-based estimates can drift.
Results: what you will see
After you click the button, you will see two headline outputs and a breakdown.
Impact vs Index (USD)
This is your beta-weighted market exposure in USD.
It is not "how much money you invested".
It is closer to: "how much benchmark-like exposure your positions represent".
A quick mental shortcut:
- If the market moves 1%, your rough dollar swing is about Impact x 1%.
Portfolio Beta (multiplier)
This is the number most people watch:
- Beta = 0.6: market 1% move, account roughly 0.6% move
- Beta = 1.3: market 1% move, account roughly 1.3% move
- Beta = -0.3: your account behaves more like a net hedge / inverse posture
Position breakdown
This shows which positions contribute the most to your total impact. This is where the calculator earns its keep, because it answers the real question:
"What is driving my risk right now?"
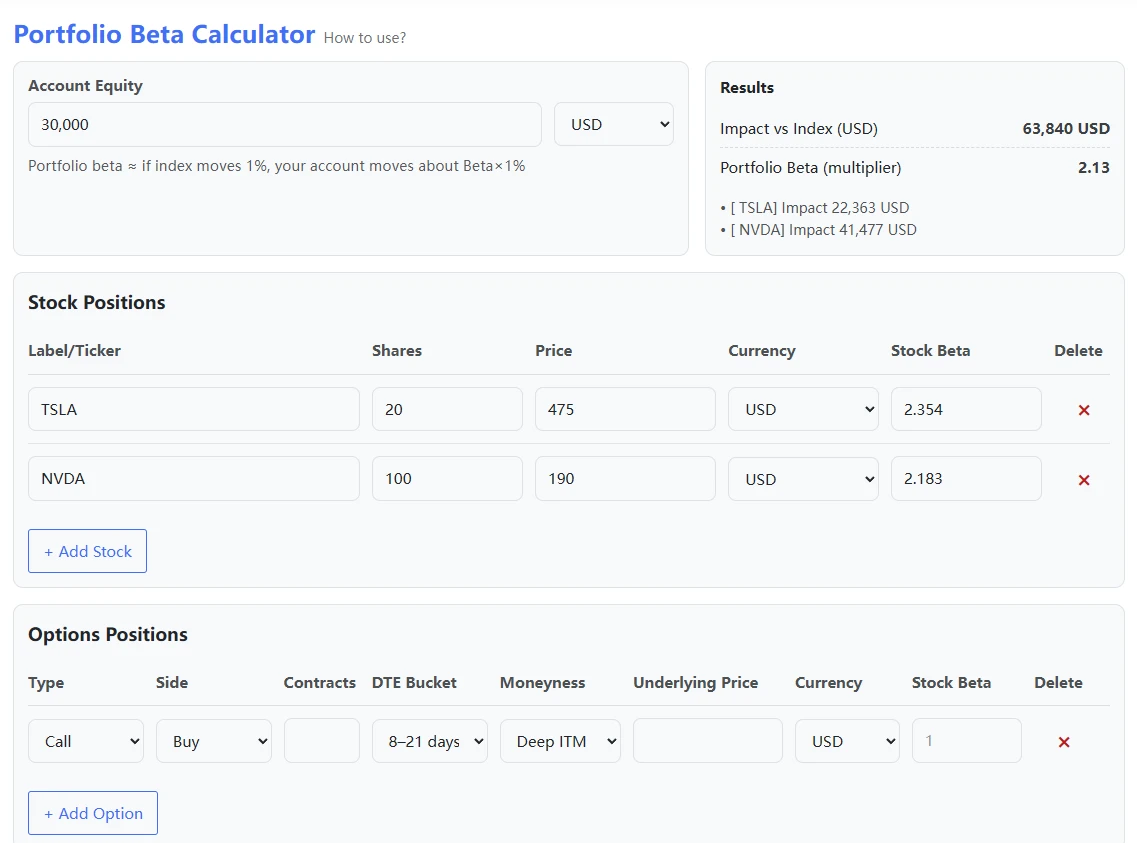
Example calculation
Assume you enter:
Account equity: 30,000 USD
Stock positions:
- TSLA: 20 shares, price 475, beta 2.354
- NVDA: 100 shares, price 190, beta 2.183
Options: none
The simplified math looks like this:
(20 x 475 x 2.354 + 100 x 190 x 2.183) / 30,000 ≈ 2.13
Why can portfolio beta be lower than the stock betas you entered?
Because you may still hold cash. Cash is effectively beta 0, so it pulls the overall portfolio beta down.
If your total exposure exceeds your equity (margin), the opposite happens. Leverage pushes portfolio beta up.
Privacy and data
All calculations run in your browser.
Your inputs are not uploaded or stored. Nothing is written to our server database.
Refreshing or leaving the page clears your entries (aside from your browser's own autofill behavior).
Summary
Portfolio beta is a way to stop guessing and start measuring.
When the market moves 1%, your account tends to move about:
Portfolio Beta x 1%
The biggest risk is not volatility by itself.
It is volatility you did not realize you were carrying.