Opportunity cost is what you give up when you choose one option over another.
In investing, it usually means: "If I put my money into this trade, what did I miss by not putting it into the boring, steady alternative?"
If your investing recap is only "green or red", you are missing the part that actually matters.
Because you can be green and still have a problem:
- You took real risk.
- You sat through real volatility.
- You paid real costs.
- And after all that, you still did not beat the "do almost nothing" option.
That is where this calculator helps.
Why this calculator exists
Most people do not lose money because they cannot pick stocks.
They lose money because they do not count the full bill:
- Borrowing costs (margin interest).
- Taxes (when applicable).
- Small fees that quietly add up.
- Inflation (the "silent discount" on your future money).
This calculator is a simple reality check. It answers:
1) Did your investment beat a risk-free plan?
2) How much did costs and taxes drag your result down?
3) After inflation, did your purchasing power actually improve?
What you will need before you start
You do not need spreadsheets. Just gather a few numbers:
- Your principal (starting capital).
- Your total P/L for the period (profit as positive, loss as negative).
- Your holding period (years, months, days).
- If you used margin: borrow amount, APR, days borrowed.
- Optional: an estimate for other costs, tax rate, risk-free rate, inflation rate.
Then you are ready.
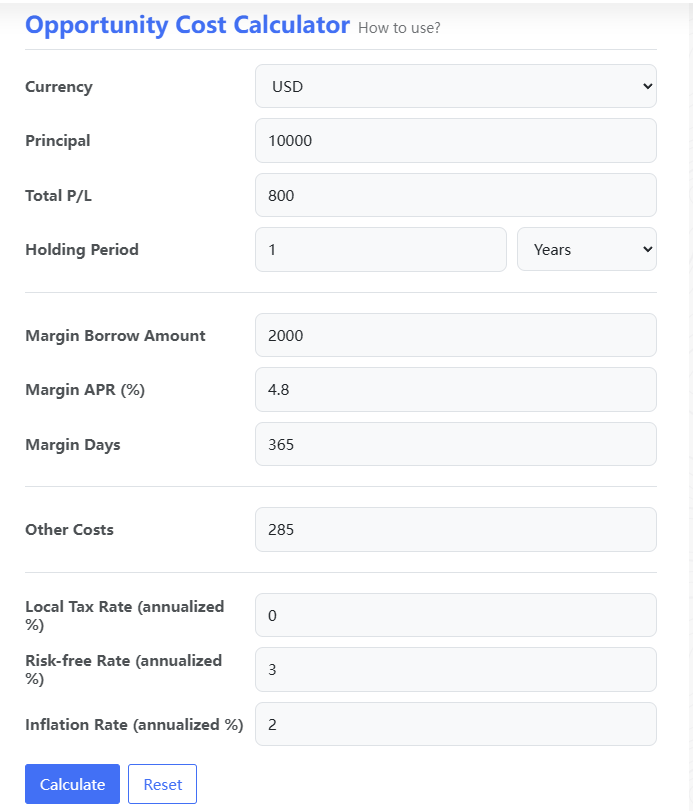
Input fields explained
Investment P/L section (core)
Currency
Pick the currency you want to display. Use the same currency for every number you enter.
Principal
Your starting capital for this "round".
Total P/L
Your total profit or loss over the whole period.
- Profit: enter a positive number (e.g., 1500)
- Loss: enter a negative number (e.g., -800)
Holding Period
How long you held the investment. Choose Years / Months / Days.
Margin section (optional, but important if you borrowed)
This section estimates the cost of borrowing.
Margin Borrow Amount
How much you borrowed.
Margin APR (%)
Annual interest rate for that borrowing.
Margin Days
How many days you actually had the borrowed balance.
Tip: Borrowing days do not have to equal holding period.
If you borrowed only part of the time, enter that.
If your Leverage (borrow/principal) is high, the calculator will show a warning tag.
That is not moral judgment. It is arithmetic.
Other Costs (optional)
Put any extra costs you want counted here:
- fees
- subscriptions
- FX friction you want to roughly include
- "small" costs that stop being small when you add them up
If you do not care, leave it as 0.
Tax, Risk-free rate, Inflation (optional, but makes the result more realistic)
Local Tax Rate (annualized %)
This is an estimate input. If you do not pay capital gains tax (or do not want to model it), set it to 0.
The calculator only applies tax when your P/L is positive.
Risk-free Rate (annualized %)
This is your baseline. The "I did nothing complicated" alternative.
Use something you could realistically earn with minimal risk in the same currency.
Inflation Rate (annualized %)
This adjusts your ending value into "real" purchasing power.
If you want a quick reality check, leave it at a reasonable estimate.
How to use (step-by-step)
1) Choose Currency.
2) Enter Principal.
3) Enter Total P/L (profit positive, loss negative).
4) Enter Holding Period and select unit.
5) If you used margin, fill in the Margin fields.
6) Add Other Costs if you want them included.
7) Optionally set Tax / Risk-free / Inflation assumptions.
8) Click Calculate.
To start over, click Reset.
Reading the results
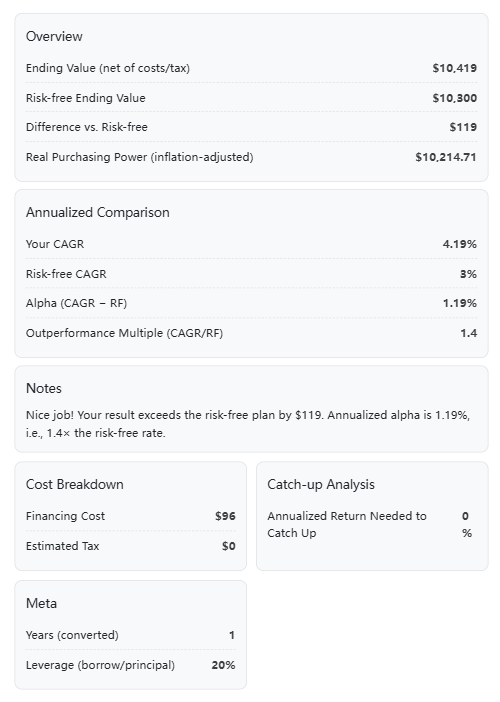
1) Overview
Ending Value (net of costs/tax)
Your result after subtracting borrowing costs, taxes (if applicable), and other costs.
Risk-free Ending Value
What your principal would have grown to if it earned the risk-free rate for the same time period.
Difference vs. Risk-free
This is the scoreboard:
- Positive: you beat risk-free.
- Negative: you underperformed the boring baseline.
Real Purchasing Power (inflation-adjusted)
Your ending value adjusted for inflation.
This answers: "Did this actually make my money more useful?"
2) Annualized Comparison
Your CAGR
One-sentence definition: CAGR is the "smooth" annual return that would take you from start to finish.
It turns uneven performance into a single comparable yearly rate.
Risk-free CAGR
The annualized version of your risk-free baseline.
Alpha (CAGR - RF)
Your annualized outperformance versus the risk-free rate.
Outperformance Multiple (CAGR/RF)
A simple ratio for intuition: how many "risk-free units" your annualized return represents.
If CAGR shows "--", it usually means the calculator cannot annualize sensibly (e.g., time is zero, or ending value is not positive).
3) Cost Breakdown
Financing Cost
Estimated margin interest cost.
Estimated Tax
Only applied when your total P/L is positive (and your tax input is > 0).
4) Catch-up Analysis
Annualized Return Needed to Catch Up
If you are behind risk-free, this tells you the annualized return you would need over the next 3 years to catch up to the risk-free outcome.
This is not a prediction.
It is a pressure test: "How hard do I need to run to reach where I could have been by walking?"
5) Meta
Years (converted)
Your holding period converted into years for consistent math.
Leverage (borrow/principal)
A quick risk indicator:
- 0% means no borrowing.
- 50% means you borrowed half your principal.
- Higher leverage means borrowing costs and volatility matter more.
What the calculator is doing (the "trust me, but show me" part)
This tool keeps the math simple on purpose. The key ideas:
A) Net ending value
It starts with your principal and P/L, then subtracts costs:
Net Ending = Principal + P/L - Financing Cost - Estimated Tax - Other Costs
B) Risk-free baseline
It compounds your principal at the risk-free rate for the same time period:
Risk-free Ending = Principal * (1 + Risk-free Rate) ^ Years
C) The opportunity cost gap
Gap = Net Ending - Risk-free Ending
That gap is the main point of the entire tool.
D) Inflation-adjusted "real" value
It converts the net ending value into purchasing power terms:
Real Value = Net Ending / (1 + Inflation Rate) ^ Years
E) Borrowing cost estimate (margin)
The calculator uses a straightforward estimate:
Financing Cost ≈ Borrow Amount * APR * (Days / 365)
F) Tax estimate
Tax is applied only when P/L is positive, and scaled by time (as an annualized estimate).
It is capped so it will not exceed the profit itself.
Common mistakes (and quick fixes)
- Mixing currencies
Do not enter USD principal and HKD P/L. Pick one currency and stay consistent. - Entering % into Total P/L
Total P/L is an amount (e.g., 1500), not "15%". - Forgetting borrowing days
Margin interest depends on how long you borrowed, not just how long you held. - Picking a fantasy risk-free rate
Risk-free is a baseline, not a motivational quote. - Ignoring inflation when comparing long periods
Over multiple years, inflation can quietly erase a "fine" nominal outcome.
Privacy and data
This calculator runs in your browser. Your inputs are processed on the only front end.
If you refresh or leave the page, your entries disappear (unless your browser's own autofill remembers them).
Wrap-up
This tool is not here to tell you what to buy.
It is here to answer a sharper question:
"Was the risk you took actually paid for - after costs, taxes, and inflation - compared with the boring baseline you could have chosen?"
If you beat risk-free, good. Keep your receipts and stay humble.
If you did not, also good. That is not failure. That is information.
And information is cheaper than tuition.