This calculator is for one thing: turning "sell a bit / buy a bit / average down (or up)" into clear numbers.
We enter a few basics, and get back: what was realized, what remains, what the remaining position effectively costs now, and what it would take to reach a target average.
Stock Add/Sell & Average Cost Calculator: Supports USD & HKD.
Why we built this calculator
In stocks, price moves fast. Our memory moves… creatively.
Average cost is the simplest "reference line" most investors use:
- Current price above average cost: feels like we're up.
- Current price below average cost: feels like we're down.
The trouble starts when the share count changes:
we trim, we add, we trim again, and suddenly the situation stops being intuitive.
This calculator keeps the story straight.
It’s mainly used for 3 situations:
- Trim (partial sell): after selling X shares at Y price, what changed?
- Add-on (simulate): if we buy X shares at Y price, what’s the new average?
- Target average (backsolve): if we want the overall average to become A, how many shares (and how much cash) does it take at price B?
Inputs explained
Partial Close Calculator
Original Shares: how many shares are currently held (e.g., 1,000)
Original Avg. Cost: the current average entry cost (e.g., 1.00 USD)
Position value (at average cost) = Avg. Cost × Shares
Shares to Sell: how many shares are sold in this trade
Sell Price: the price used for this sale
After clicking "Calculate Result", we get:
Realized P/L: (Sell Price − Original Avg. Cost) × Shares Sold
This is the profit/loss locked in by this sale.
Realized P/L vs Initial Cost (%): realized P/L as a percentage of the original money put in
It answers: "How big is this realized result compared with the original position cost?"
Shares Remaining: Original Shares − Shares Sold
Net Cost per Remaining Share: the remaining position's "effective cost" after this sale
Intuition: once cash is recovered by selling, the remaining shares are effectively carried at a different cost level.
Cash Proceeds (This Sale): Shares Sold × Sell Price
This is the cash that comes back from the sale.
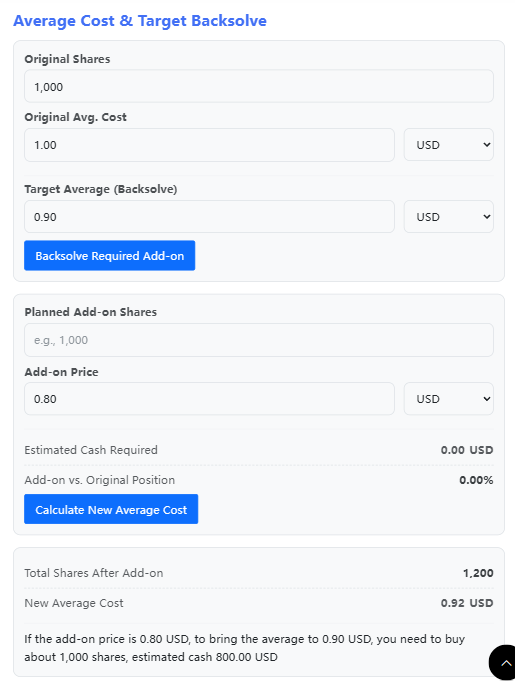
Average Cost & Target Backsolve
This area supports two common workflows.
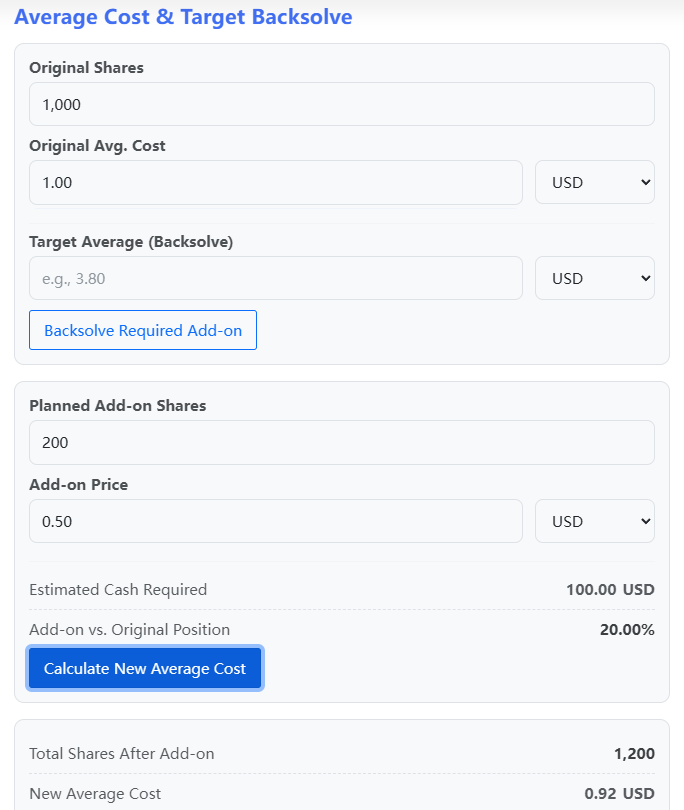
(A) Add-on simulation
Original Shares and Original Avg. Cost: same idea as above
Planned Add-on Shares: how many shares we plan to buy
Add-on Price: the assumed buy price (often the current price, sometimes a planned price)
After clicking Calculate New Average Cost, we get:
Estimated Cash Required: Planned Add-on Shares × Add-on Price
Add-on vs. Original Position (%): how meaningful the add-on is relative to the original size
Total Shares After Add-on: Original Shares + Add-on Shares
New Average Cost: the updated average cost after buying more
(B) Target average (backsolve)
Target Average (Backsolve): the overall average we want to reach after adding
Then we enter Add-on Price, and click Backsolve Required Add-on
The calculator outputs a direct sentence:
"If the add-on price is X, to bring the average to Y, we need about N shares, estimated cash Z."
One key rule (in normal language):
Target Average must be a "middle number" between the Original Avg. Cost and the Add-on Price, and it cannot be exactly the Add-on Price.
Reason: an average can be pulled toward the add-on price, but it cannot be pulled past it.
FAQs
What is average cost?
It's the blended entry cost of the shares currently held, based on how many shares were bought at which prices.
Why calculate partial-sell results?
Because selling changes the situation: part of the outcome becomes locked in, and the remaining position effectively carries a different "break-even feel."
What is target-average backsolve for?
It turns "I want the average to become ___" into a concrete share count and cash number.
Does this work for US and HK stocks?
Yes. It’s share-and-price math. We just choose the matching currency.
How to use
Partial sell: a clear view of what was realized and what remains
Fill these 4 fields:
- Original Shares
- Original Avg. Cost
- Shares to Sell
- Sell Price
Click Calculate Result.
A simple way to read the output:
- Realized P/L tells what this sale locked in.
- Net Cost per Remaining Share tells where the remaining position "effectively sits" after the sale.
- Cash Proceeds tells how much cash came back.
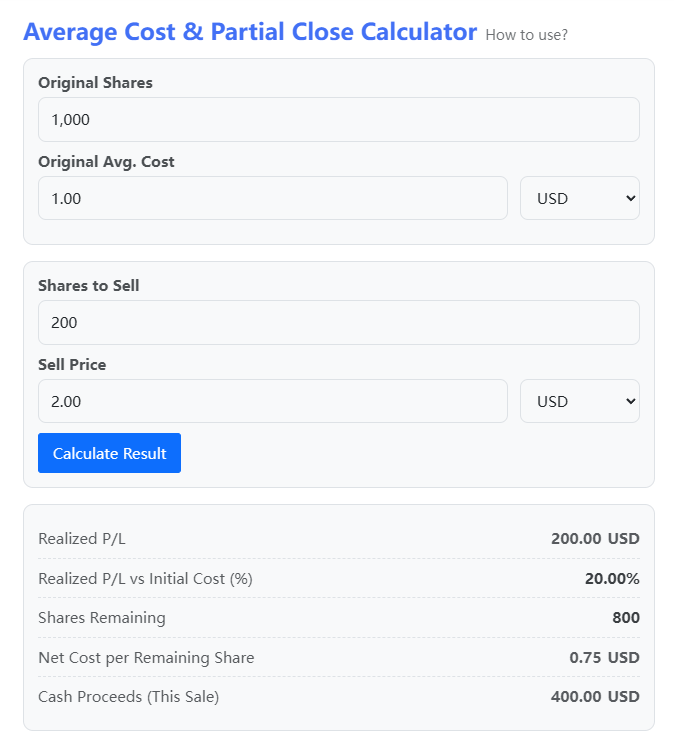
Profit example
Original Shares: 1,000
Original Avg. Cost: 1.00
Sell: 200
Sell Price: 2.00
Realized P/L is positive.
Net Cost per Remaining Share typically drops, because some profit was already taken out in cash.
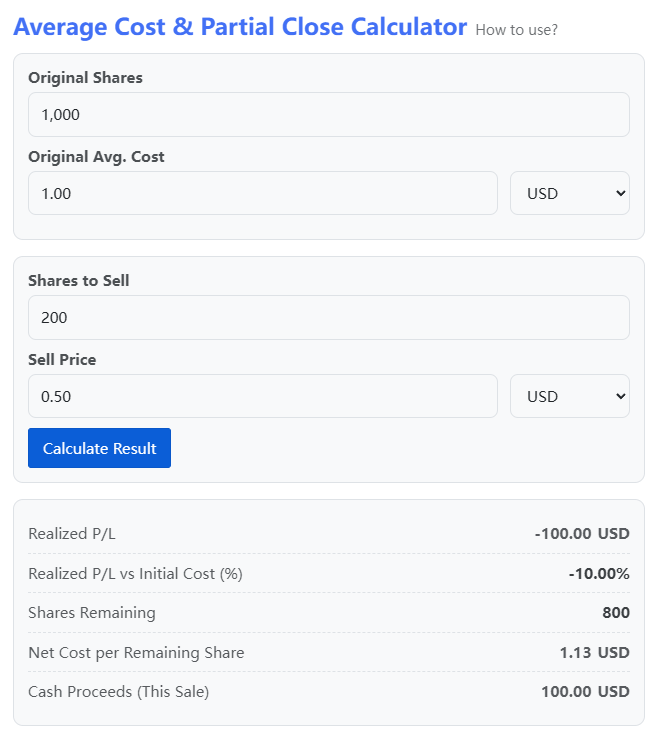
Loss example
Original Shares: 1,000
Original Avg. Cost: 1.00
Sell: 200
Sell Price: 0.50
Realized P/L is negative.
Net Cost per Remaining Share typically rises, because the remaining position now needs a larger move to offset what was realized.
Add-on simulation: see the new average before buying
Fill these 4 fields:
- Original Shares
- Original Avg. Cost
- Planned Add-on Shares
- Add-on Price
Click Calculate New Average Cost.
The math is a weighted average:
New Average = (Old Shares × Old Avg + Add-on Shares × Add-on Price) ÷ (Old Shares + Add-on Shares)
Practical takeaway:
if the add-on is small relative to the original size, the average won’t move much.
(“Small add-on, small change” is not a philosophy. It’s arithmetic.)
Backsolve target average: plan the average instead of guessing it
Fill these 4 fields:
- Original Shares
- Original Avg. Cost
- Add-on Price
- Target Average (Backsolve)
Click Backsolve Required Add-on.
The calculator gives one straight answer:
how many shares and how much cash the target implies at that assumed price.
Key restriction (again, in plain terms):
Target Average must be between the Original Avg. Cost and the Add-on Price, and cannot be equal to the Add-on Price.
Because the overall average can be pulled toward the add-on price, but it cannot cross it.
Privacy & data policy
All calculations run in the browser.
Inputs are not uploaded or stored and nothing is written to our server database.
Closing or refreshing the page clears entries (aside from your browser’s own autofill behavior).
Summary
This tool is a “decision scratchpad”:
- before trimming, we can see what gets realized and what remains
- before adding, we can see how much the average actually moves
- before chasing a target average, we can see what it really costs
For educational use only. Not investment advice.